
Understand the potential drug-drug interaction liabilities of your compounds by using our cytochrome P450 (CYP) induction relative induction score assessment.
The relative induction score assessment is one of Cyprotex's in vitro experimental ADME services. Cyprotex delivers consistent, high quality data with the flexibility to adapt protocols based on specific customer requirements.
Introduction
Evaluating the potential for DDIs due to CYP induction is an important part of the drug development process. The US, European and Japanese regulatory agencies have published guidance documents on how to conduct these studies and have recommended approaches by which to assess the potential for DDIs utilising in vitro induction data and predicted human exposure.
The most basic methods use 'static' equations to assess the ratio between various measures of human exposure and induction potency. Correlation methods such as using relative induction score (RIS) are also recommended where the magnitude of clinical CYP3A4 induction is predicted from a victim drug in presence and absence of those inducers. Cut-off values are then used to indicate whether there is potential for a DDI and if a clinical study may be required to investigate the magnitude of the interaction in vivo.
Determining potential induction of CYP enzymes using the RIS correlation method:
- Using the RIS method, batches of hepatocytes are qualified for subsequent induction studies.
- The qualification process assesses a set of known inducers, covering in vivo induction potency from non-inducers to strong CYP3A4 inducers.
- Emax and EC50 values are determined for all inducers and applied alongside predicted clinical unbound Cmax to calculate RIS. RIS values for each inducer are subsequently correlated vs. observed in vivo change in the AUC of CYP3A4 victim.
- The relationship between in vitro inducing potency (RIS) and observed in vivo effect on CYP3A4 victim drug for the qualification data (RIS calibration curve), is then used to predict magnitude of in vivo induction of an investigational drug.
- If this is greater than a predefined cut-off of 20% decrease in AUC of CYP3A4 victim (AUCR ≤ 0.8), the investigational drug is considered positive for induction in vivo and follow-up is recommended either using mechanistic modelling or conducting a clinical DDI study.
Protocol
Cytochrome P450 Induction: Relative Induction Score Protocol
Data
Calibration Data from Cyprotex's CYP Relative Induction Score (RIS) Assay
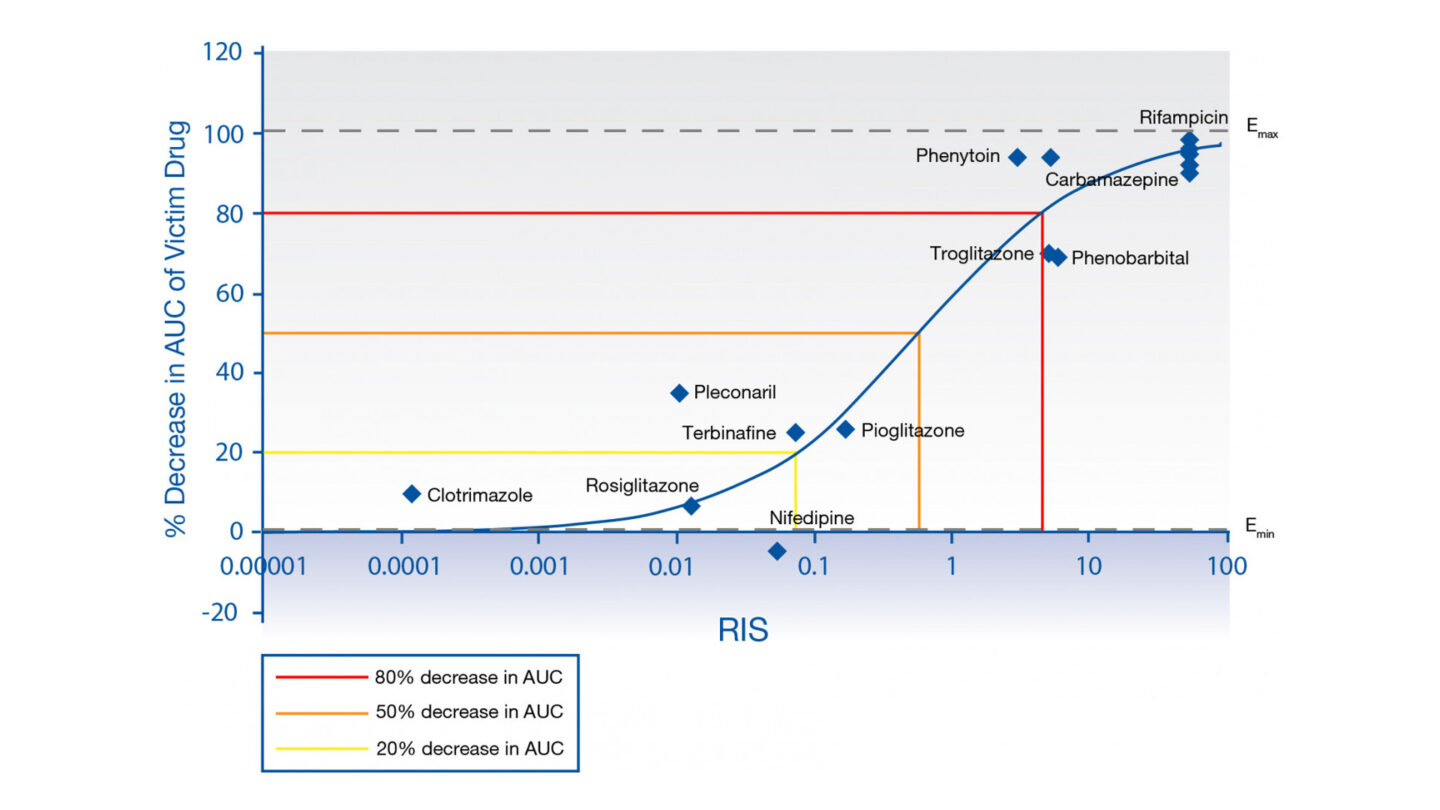
Figure 1
RIS calibration curve for HUM182351 mRNA, based on Imax,u.
Q&A
What benefit does relative induction score correlation method offer compared to basic fold induction?
Basic methods of assessing in vitro induction simply apply a cut-off to fold induction observed i.e. concentration-dependent increase of mRNA expression with fold change ≥2-fold relative to vehicle control or increase >20% of positive control, at expected hepatic concentrations of drug. This provides a conservative potential risk of clinical DDI due to induction. The relative induction score (RIS) correlation method however, characterizes a batch of hepatocytes by assessing a panel of clinical inducers, and on defining the in vitro induction parameters Emax and EC50, correlating this with clinical inductive effect and in vivo exposure data to determine RIS score1. Utilizing this calibration, the magnitude of clinical inductive effect can be predicted for test compounds enabling investigators to model and better understand the DDI risk for improved decision-making before the need to progress to clinical trials.
Does the assay design and data analysis meet both FDA and EMA requirements?
The standard Cyprotex induction assay design meets the criteria for both regulators. Cryopreserved human hepatocytes from three separate donors are assessed, with a 72 hour incubation period, replacing media containing drug daily. Positive controls recommended by the regulators, omeprazole (CYP1A2), phenobarbital (CYP2B6) and rifampicin (CYP3A4, CYP2Cs) are run alongside. The extent of induction is assessed by mRNA expression and enzyme activity (if induction due to protein stabilization is suspected). Cytotoxicity assessment is performed alongside measurement of test compound in the media at different time points on the last day of incubation2, 3.
As the donors are RIS-characterized, should the results meet the criteria of observing >2-fold CYP3A4 induction with concentration-dependence in more than one donor, the RIS assessment can be performed, to provide additional data to the sponsor and for the regulators. To fulfil the extra RIS requirements, we run two positive controls, rifampicin and phenobarbital, which are part of the characterisation set in each assay and a negative control to confirm the assay response in comparison to the qualification data. We determine RIS utilising maximum unbound plasma concentration as recommended by both FDA and EMA2,3.
Do you use fold induction or fold increase for determining RIS scores?
The in vitro induction analysis calculates fold induction relative to vehicle control. This maintains the same nomenclature as regulators when assessing basic fold induction thresholds (i.e. 2-fold). Where appropriate, Emax and EC50 are determined using four-parameter sigmoidal curve where Emin is constrained to 1 (assumes vehicle control equals no change in fold induction).
For further IVIVE (RIS and R3 determination), fold increase (fold induction -1) is determined in agreement with industry opinion, and Emax and EC50 re-calculated accordingly4, 5.
What approach do you take if you do not observe a maximum plateau of inductive effect? How do you determine Emax and EC50?
If no apparent plateau is observed over the concentration range tested, the Emax will be constrained to the maximum observed Emax, and EC50 will be determined accordingly. This avoids extrapolating beyond the measured data and is in accordance with literature. Equally, additional curve-fitting criteria in the case of atypical or bell-shaped curves are applied and data points may be excluded6. A decrease in induction at higher concentrations can usually be explained as a result of solubility or cytotoxicity issues.
Why do you only have RIS correlation for CYP3A4?
There is only sufficient clinical data to perform the RIS analysis for CYP3A4 with the majority of the data in the qualification set taken from clinical studies using the sensitive CYP3A4 substrate, midazolam. Currently there is insufficient clinical data available with specific CYP1A2/2B6 inducers and sensitive CYP1A2/CYP2B6 substrates to build similar correlations for these isoforms7,8.
References
1) Fahmi OA et al., (2008) Prediction of drug-drug interactions from in vitro induction data: Application of the relative induction score approach using cryopreserved human hepatocytes. Drug Metab. Dispos 36(9):1971-1974
2) US Food and Drug Administration (2020) Final guidance for industry: In Vitro Drug Interaction Studies – Cytochrome P450 Enzyme- and Transporter-Mediated Drug Interactions Guidance for Industry (available to view here)
3) European Medicines Agency Guideline on the Investigation of Drug Interactions EMA/CHMP/EWP/125211/2010 (available to view here)
4) Kenny JR et al., (2018) Considerations from the Innovation and Quality Induction Working Group in response to Drug-Drug Interaction guidances from regulatory agencies: Focus on CYP3A4 mRNA in vitro response thresholds, variability and clinical relevance. Drug Metab. Dispos 46:1285-1303
5) Cheng Y et al. (2016) Applications of static models to predict midazolam clinical interactions in the presence of single or multiple hepatitis C virus drugs. Drug Metab. Dispos 44:1372-1380
6) Wong SG et al., (2021) Considerations from the Innovation and Quality Induction Working Group in response to drug-drug Interaction guidance from regulatory agencies: Guidelines on model fitting and recommendations on time course for in vitro cytochrome P450 induction studies including impact on drug interaction risk assessment. Drug Metab Dispos 49: 94-110
7) Fahmi OA et al., (2016) Evaluation of CYP2B6 induction and prediction of clinical drug-drug interactions: Considerations from the IQ Consortium Induction Working Group-An Industry Perspective. Drug Metab. Dispos 44:1720-1730
8) Klomp F et al., (2020) Drug-drug interactions involving intestinal and hepatic CYP1A enzymes. Pharmaceutics 12(12): 1201
Downloads
- Cyprotex ADME Guide 5th Edition >
- Cyprotex DDI Regulatory Guide 3rd Edition >
- Cytochrome P450 Induction: Relative Induction Score (RIS) Factsheet >