Toxicity remains a major cause of drug attrition. More intricate new approach methodologies (NAMs) are being developed to enhance drug safety evaluation and Cell Painting is one of these. This is a high-content phenotypic profiling assay, integrating analysis to provide point of departure (PoD) data.
Cyprotex delivers consistent, high-quality data with the flexibility to adapt protocols based on specific customer requirements.
Introduction
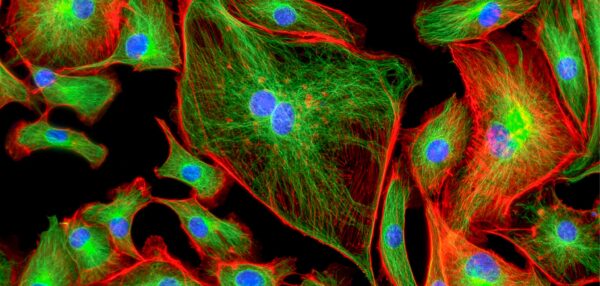
- High content imaging using a multiplexed staining strategy to visualize organelles and cellular components, enabling the detection of subtle changes in morphological features.
- Simple, quick and automated workflow providing readouts for over 1,500 features.
- This powerful technique enables a deep exploration of cellular morphology, helping you uncover mechanisms of action, assess compound toxicity, and identify phenotypic changes in response to various treatments.
- Cost-effective and scalable solution for drug discovery to assess potential safety and toxicity risks.
- Use of two published methods, the JUMP cell painting consortium (JUMP-CP method) and an US Environmental Protection Authority (EPA) method.
Protocol
Cell Painting Assay

Data
Data from Cell Painting Assay
Data Analysis
Plate QC analysis is performed by calculating the standard deviation and coefficient of variation (CV) for each labelled feature obtained from 32 solvent control wells. If a CV value exceeds 25%, the plate is excluded from the analysis.
Pre-processing of cell painting features is performed to exclude unsuitable features from the analysis. The readouts are then reduced to a curated set of features, organized into 30 feature groups with a total of 575 individual morphological features.
Cell count is normalized by dividing the mean of the 32 solvent control wells, so values range from zero to one (unless a condition leads to an increased cell count).
The aim of the assay is to determine compound concentrations at which relevant morphological changes occurred, termed points of departure (POD) (Figure 3 &4). The concentration-response profiling is determined according to the procedure outlined in Nyffeler et al., 2020. Bioactivity screening of environmental chemicals using imaging-based high-throughput phenotypic profiling. Toxicology and Applied Pharmacology. 399, 114876
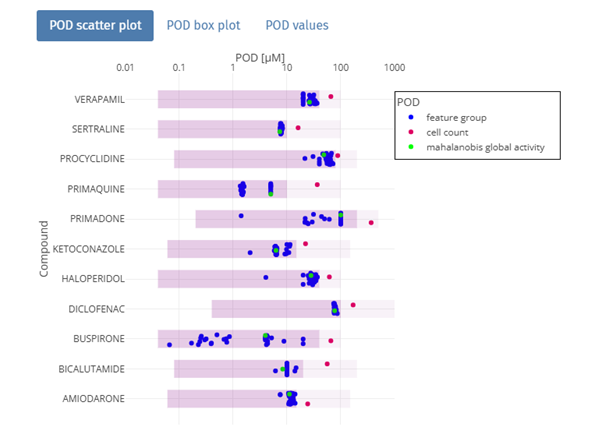
Fig 3. Scatter plot showing POD values for all the respective feature groups of compound treated HepG2 cells.
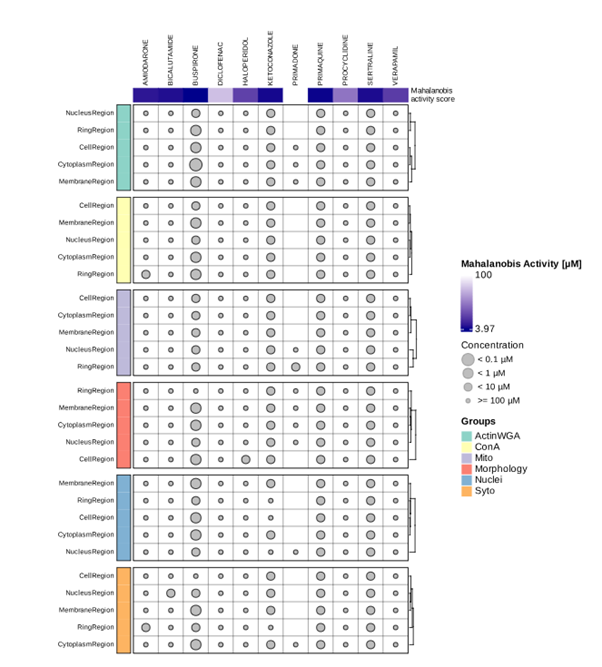
Fig 4. Diagram to show the feature group-based POD values of compound treated HepG2 cells.
Q&A
How does the Cell Painting Assay work?
Cyprotex's cell painting assay follows a structured, multi-step workflow designed for high-content, phenotypic profiling as detailed below:
Seed: The assay begins with seeding the cells of interest into multi-well screening plates. The density at which the cells are plated is carefully chosen to ensure optimal growth and coverage, allowing for consistent and reliable imaging. This step is crucial as it sets the foundation for the entire experiment, ensuring that cells are evenly distributed across the plate for uniform treatment.
Dose: After an initial 24-hour incubation period, the cells are exposed to a set of control compounds along with the test compounds of interest. These treatments are designed to probe cellular responses. Control compounds are used as benchmarks, helping to assess the baseline or expected effects, while the test compounds allow researchers to observe potential novel or therapeutic outcomes. This dosing step is essential for evaluating how different treatments alter cellular behavior.
Label: Following a 24-hour treatment, the cells are stained with a combination of fluorescent dyes. These dyes are designed to highlight specific cellular components such as the nucleus, mitochondria, and cytoskeleton. The multi-channel labeling enables the visualization of distinct cellular structures and processes, providing a comprehensive morphological snapshot of each cell.
Image: The stained cells are imaged using a high-content screening platform. This automated imaging system captures high-resolution images across multiple fluorescent channels. Each channel corresponds to a specific dye, allowing for the simultaneous visualization of different cellular structures in the same cell. This stage generates a rich dataset that serves as the foundation for detailed analysis.
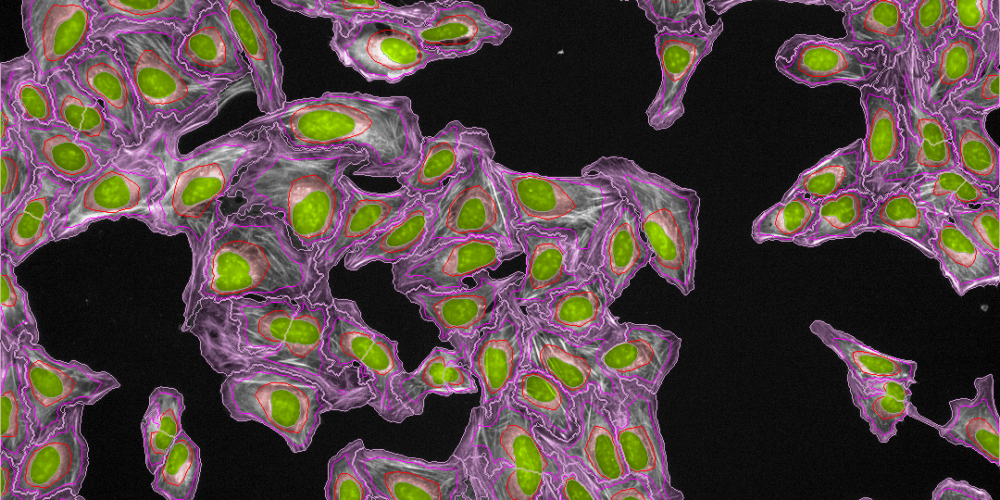
Analysis: The images are processed using advanced image analysis software, which segments individual cells and extracts quantitative features from each labeled cellular component. These features can include metrics like cell size, shape, texture, and fluorescence intensity. The segmentation process ensures that each cell's morphology is captured accurately for further examination.
Data Processing: The final step involves analyzing the extracted features using machine learning algorithms and high-performance computing. These tools are essential for handling the vast multi-dimensional dataset generated by the assay. The computational analysis helps identify patterns, classify compounds based on their effects, and make predictions about potential mechanisms of action. This step transforms raw image data into actionable insights for drug discovery, toxicity prediction, and other research applications.
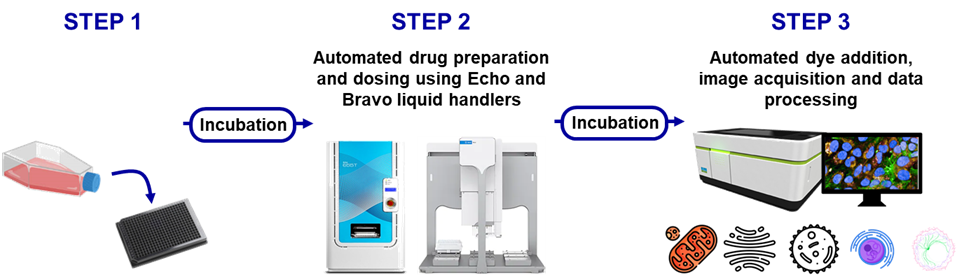
Fig 5. Typical workflow of a cell painting assay.
What are the advantages and limitations of the Cell Painting Assay?
Cell Painting offers a streamlined, automated workflow that generates hundreds of unbiased data points per sample with remarkable efficiency. This approach enables rapid and effective screening of compound libraries, facilitating the identification of individual compounds that may pose potential safety or toxicity risks. As a result, Cell Painting emerges as a cost-effective solution for assessing phenotypic effects across multiple compounds in your cells of interest.
While the assay allows the use of various dyes and cell types, its applicability may depend on the relevance of specific biological processes to your experimental conditions. Although the assay yields extensive information, interpreting the underlying biology can present challenges. Important to notice that the generated data is influenced by the statistical methodologies and tools employed for analyzing the high-dimensional dataset.